-
 Anglický jazyk
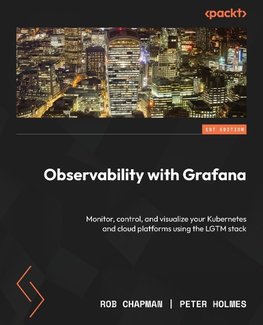
Observability with Grafana
Autor: Rob Chapman
Implement the LGTM stack for cost-effective, faster, and secure delivery and management of applications to provide effective infrastructure solutions Key Features:Use personas to better understand the needs and challenges of observability tools users Get... Viac o knihe
Na objednávku
79.56 €
bežná cena: 88.40 €
O knihe
Implement the LGTM stack for cost-effective, faster, and secure delivery and management of applications to provide effective infrastructure solutions Key Features:Use personas to better understand the needs and challenges of observability tools users Get hands-on practice with Grafana and the LGTM stack through real-world examples Implement and integrate LGTM with AWS, Azure, GCP, Kubernetes and tools such as OpenTelemetry, Ansible, Terraform, and Helm Purchase of the print or Kindle book includes a free PDF eBook Book Description: To overcome application monitoring and observability challenges, Grafana Labs offers a modern, highly scalable, cost-effective Loki, Grafana, Tempo, and Mimir (LGTM) stack along with Prometheus for the collection, visualization, and storage of telemetry data. Beginning with an overview of observability concepts, this book teaches you how to instrument code and monitor systems in practice using standard protocols and Grafana libraries. As you progress, you'll create a free Grafana cloud instance and deploy a demo application to a Kubernetes cluster to delve into the implementation of the LGTM stack. You'll learn how to connect Grafana Cloud to AWS, GCP, and Azure to collect infrastructure data, build interactive dashboards, make use of service level indicators and objectives to produce great alerts, and leverage the AI & ML capabilities to keep your systems healthy. You'll also explore real user monitoring with Faro and performance monitoring with Pyroscope and k6. Advanced concepts like architecting a Grafana installation, using automation and infrastructure as code tools for DevOps processes, troubleshooting strategies, and best practices to avoid common pitfalls will also be covered. After reading this book, you'll be able to use the Grafana stack to deliver amazing operational results for the systems your organization uses. What You Will Learn:Understand fundamentals of observability, logs, metrics, and distributed traces Find out how to instrument an application using Grafana and OpenTelemetry Collect data and monitor cloud, Linux, and Kubernetes platforms Build queries and visualizations using LogQL, PromQL, and TraceQL Manage incidents and alerts using AI-powered incident management Deploy and monitor CI/CD pipelines to automatically validate the desired results Take control of observability costs with powerful in-built features Architect and manage an observability platform using Grafana Who this book is for: If you're an application developer, a DevOps engineer, a SRE, platform engineer, or a cloud engineer concerned with Day 2+ systems operations, then this book is for you. Product owners and technical leaders wanting to gain visibility of their products in a standardized, easy to implement way will also benefit from this book. A basic understanding of computer systems, cloud computing, cloud platforms, DevOps processes, Docker or Podman, Kubernetes, cloud native, and similar concepts will be useful.
- Vydavateľstvo: Packt Publishing
- Rok vydania: 2024
- Formát: Paperback
- Rozmer: 235 x 191 mm
- Jazyk: Anglický jazyk
- ISBN: 9781803248004

 Nemecký jazyk


